Short Examples and How-To Vignettes
- Graphjs Overview.
- Graphjs Tricks.
- Crosstalk support: crosstalk.html.
- "Stacked" 2d plots: stacked.html.
- Adding labels to a graph visualization: adding_points.html.
- Basic graph animation: animation.html.
- Interactive graph animation: advanced.html
- Correlation matrix regularization example visualization: https://bwlewis.github.io/correlation-regularization/.
- A note about CPU use: battery.html
Gallery of some examples from the package and by users (click to open)
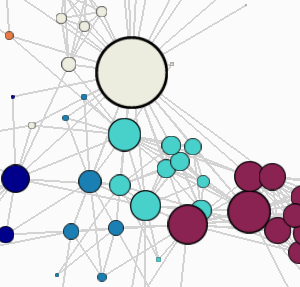
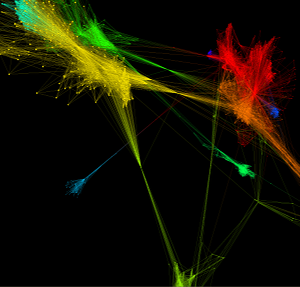
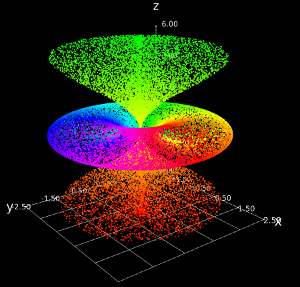
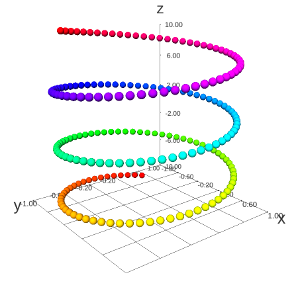
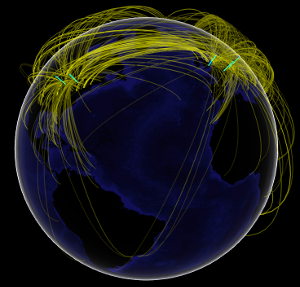
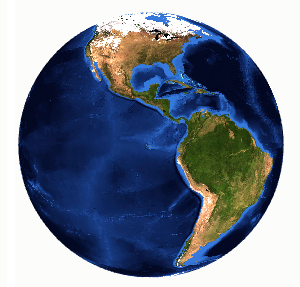
Examples run best in browsers with WebGL enabled.
Install from CRAN:
install.packages("threejs")
Install the development version of the package directly from GitHub with the devtools package: devtools::install_github("bwlewis/rthreejs")
Install the development version of the package directly from GitHub with the devtools package: devtools::install_github("bwlewis/rthreejs")